Answer a few quick questions. See your exact revenue gap, patient math, ad spend scenarios, and a 90-day growth model built from your numbers.
Not templates. Not industry averages. Your clinic. Your numbers. Your plan.
Get My Free Dashboard4,500+
Clinic audits completed
847
New patient appointments generated
4x-8x
Typical ROAS from structured campaigns
90
Days to predictable growth
Every number is calculated from your answers. No templates. No guesswork.
Takes 3 minutes. No credit card. No obligation.
This explains the exact problem your dashboard will diagnose.
Revenue, patient flow, marketing spend, treatment mix. Multiple choice and sliders. No forms, no commitments.
Takes 2-3 minutesRevenue gap, patient math, leads required, ad spend scenarios, and projected ROAS. All based on your answers.
Instant calculationEnter your clinic details to access the full dashboard. See your revenue gap, growth model, and the exact path to your target.
Free, no obligationThey started exactly where you are now
A clinic owner hesitant to try another marketing solution, having already seen little impact from previous attempts.
Before choosing ApsteQ, this practice owner evaluated several agencies offering more services at a lower price, but found that none could clearly explain what would actually bring patients in. ApsteQ’s straightforward, results-focused approach made the decision easy.
A US-based dentist who built his practice entirely on referrals never believed digital marketing applied to dentistry.
Real numbers from real practices that started with the same free audit
General + Cosmetic Practice
Before
$22K-$28K fluctuating monthly revenue
After 90 days
$58K average monthly production
96 qualified appointments in 60 days
“We always thought slow months were normal. Once structure was installed, revenue stabilized.”
Single-Location Practice
Before
$30K monthly average
After 90 days
$72K monthly production
14 additional aligner starts
“This was the first time marketing actually translated into treatments.”
3-Chair Practice
Before
30-40% underutilized capacity
After 90 days
$40K+ monthly production increase
Consistent weekly patient flow
“This isn’t marketing. It’s structure.”
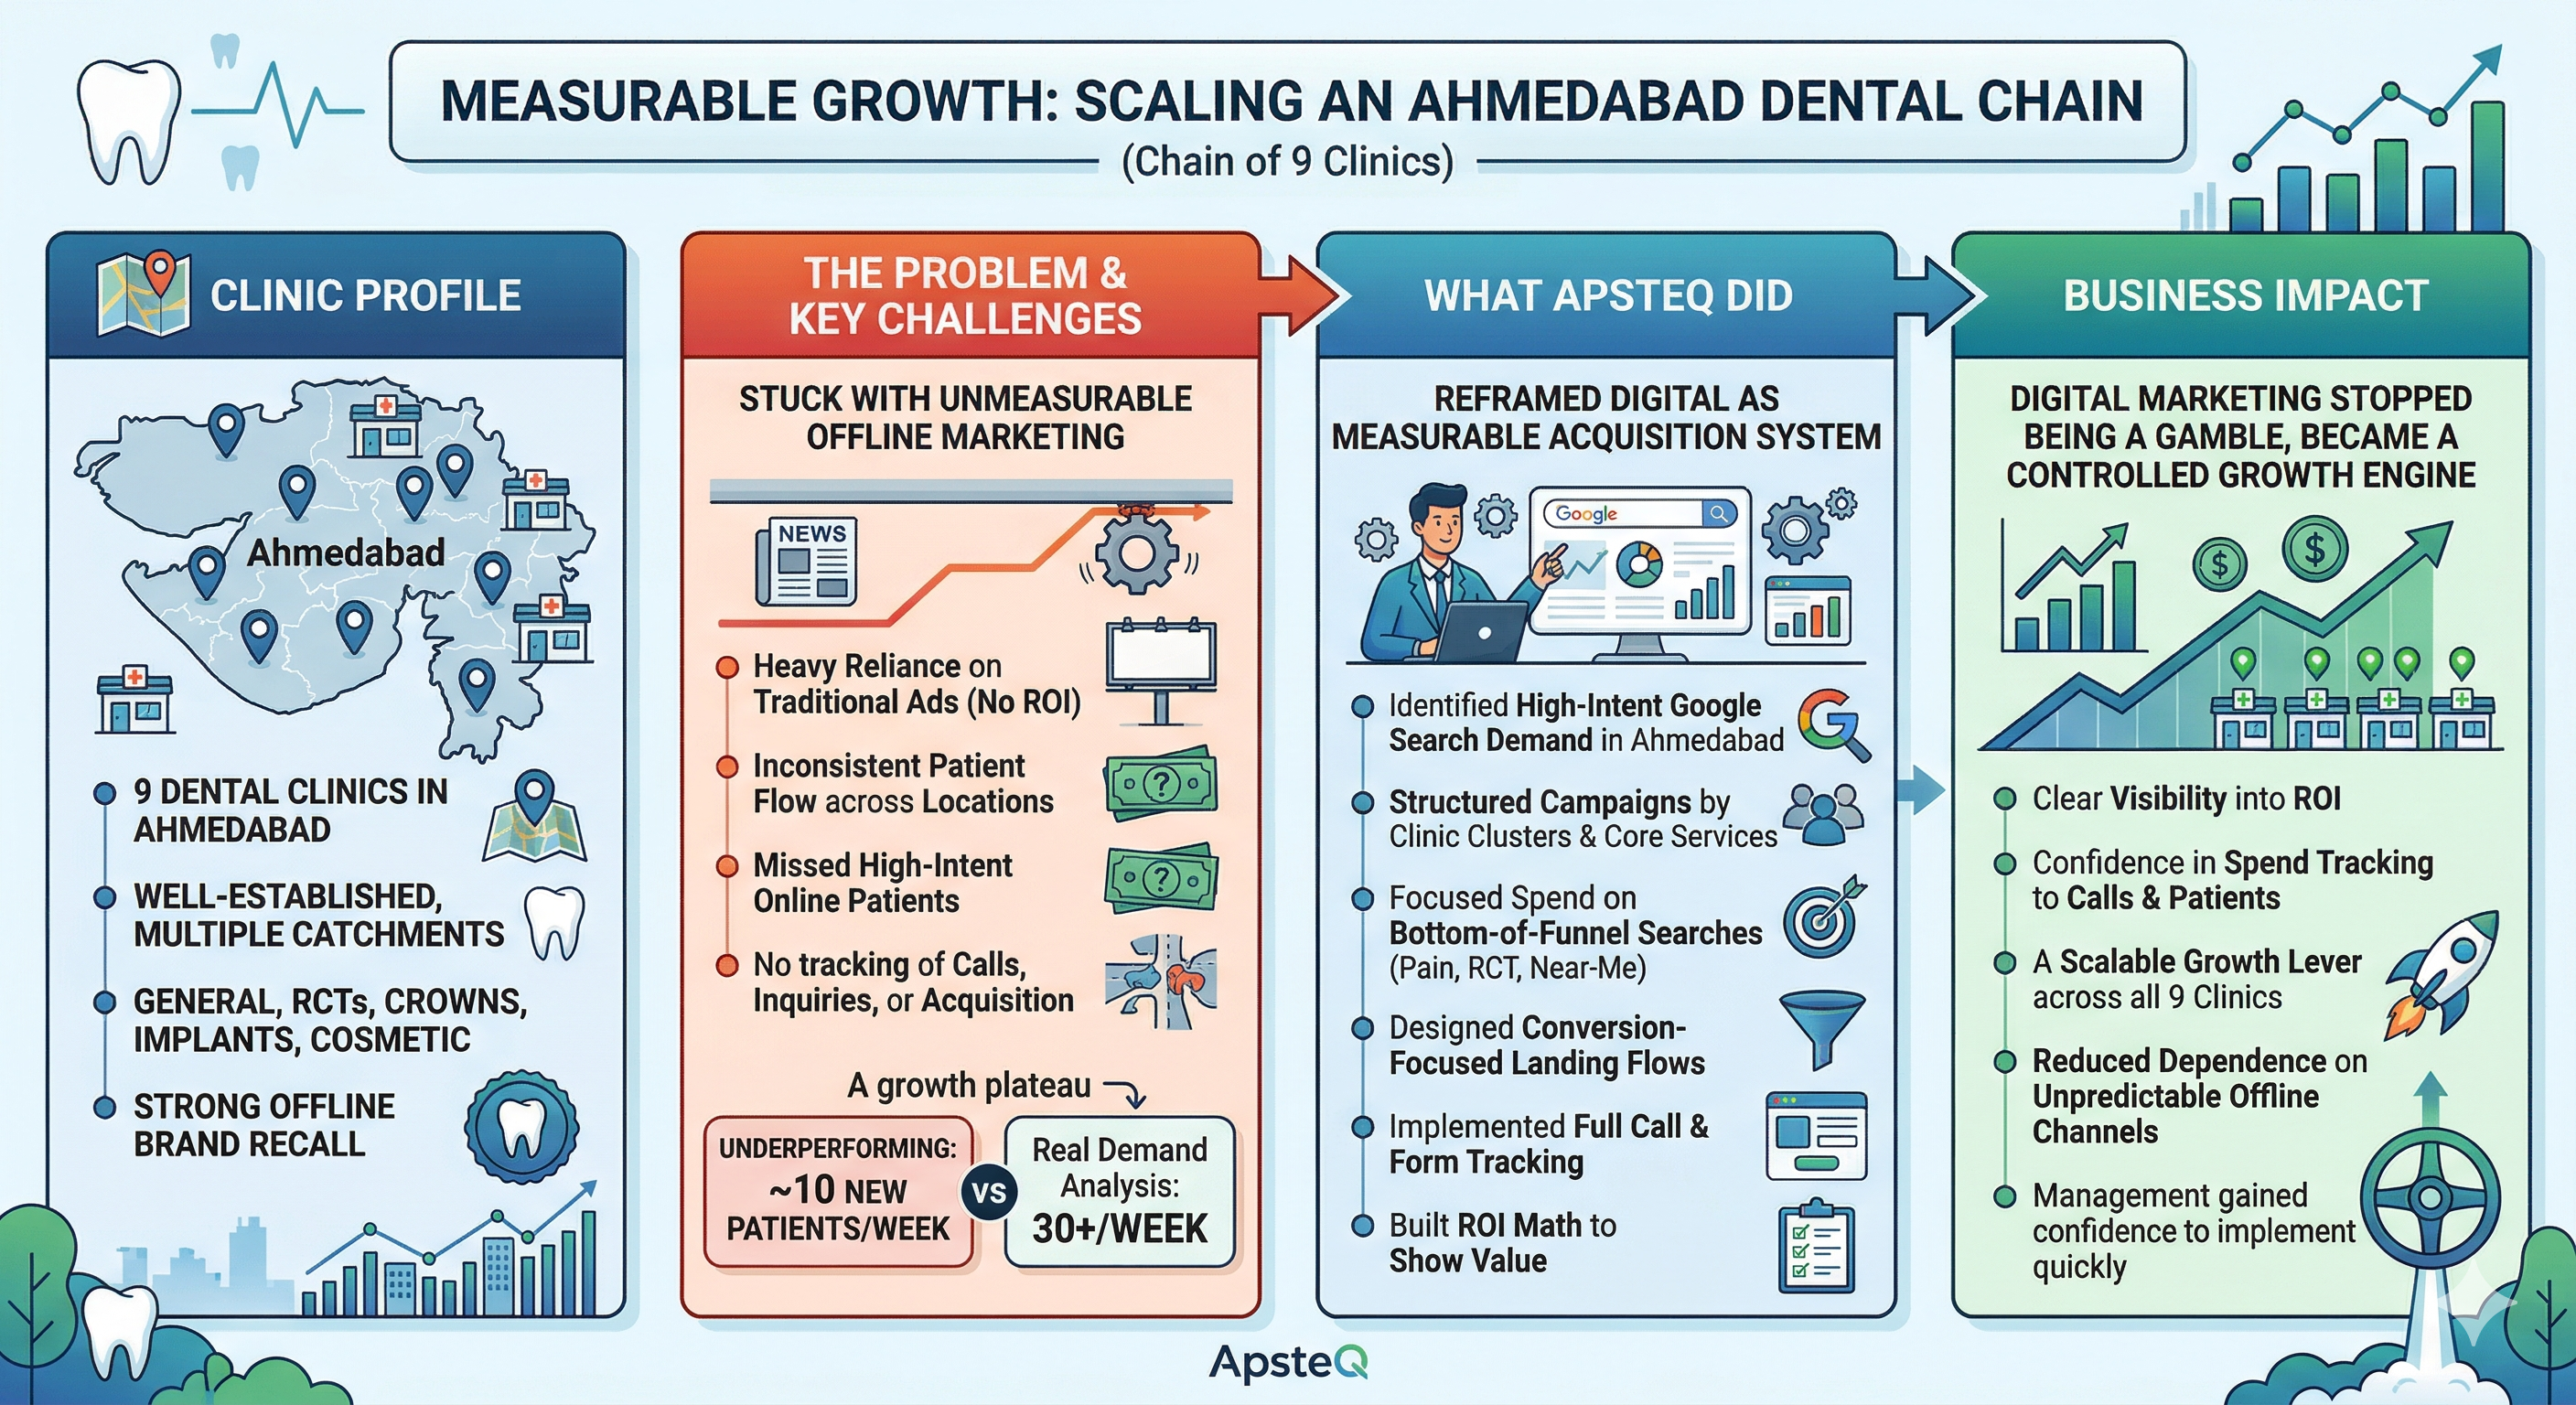
How a well-established multi-location group moved from unmeasurable offline ads to a trackable, scalable growth engine.
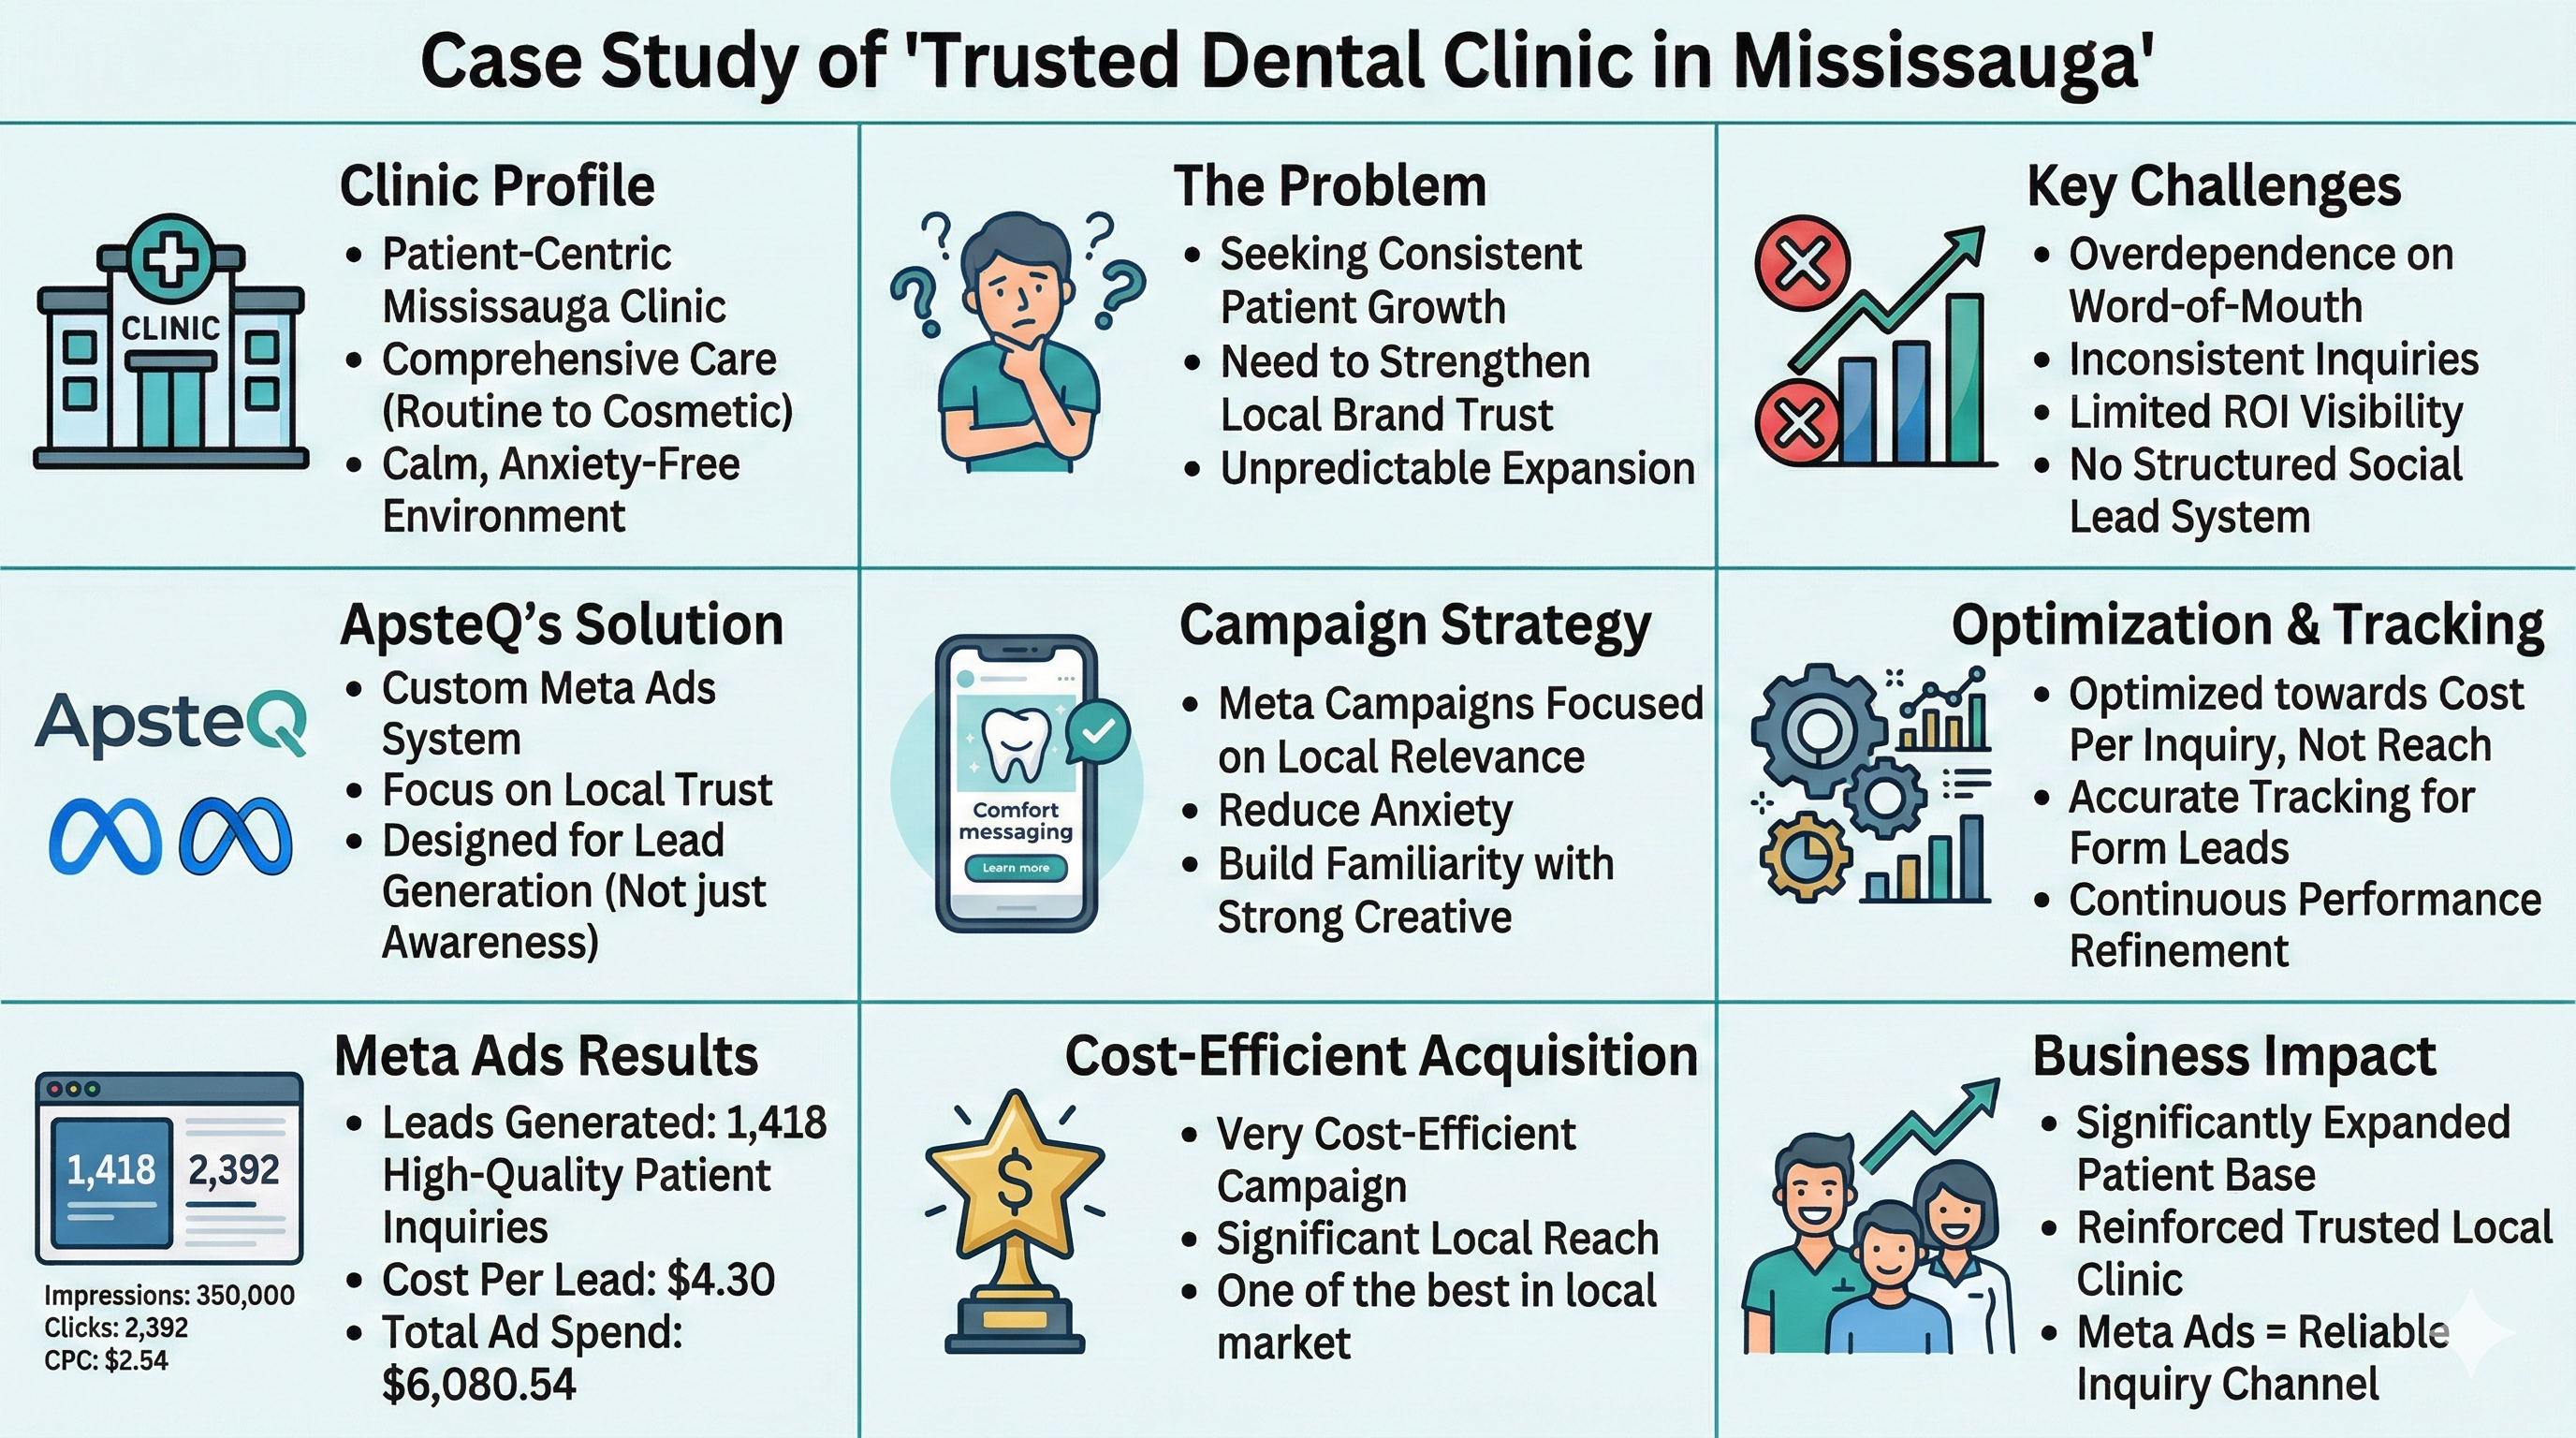
Highly targeted Meta Ads that built community trust and delivered one of the most cost-efficient patient acquisition campaigns.
Your dashboard calculates this for your specific clinic. Here is a sample.
Average treatment value
$500
× 60 qualified appointments
Potential production
$30,000
Aligner / Cosmetic case
$5,000
× 10 additional cases
Additional production
$50,000
Your dashboard calculates this exact model for your clinic's numbers.
It is not a marketing problem. It is a structure problem.
The first step is understanding your exact numbers.
That is what the dashboard gives you.
"Before this, we were running ads but couldn't really tell what was working. After the new structure was put in place, we could clearly see which campaigns were driving real patients."
Dr. Martinez
Austin, TX
"We were stuck at the same monthly numbers for almost a year. Within three months, our production almost doubled. The biggest difference was clarity."
Dr. Thompson
Charlotte, NC
"We had worked with agencies before and always felt dependent on them without understanding the numbers. This time, revenue stabilized."
Dr. Patel
Portland, OR
Ready?
You already know your target. Now see what it actually takes to get there.
No credit card. No sales call unless you want one.